History of Candlestick Patterns
All Candlestick Patterns
Contents
- 1 History of Candlestick Patterns
- 2 All Candlestick Patterns
- 3
- 4 35 Powerful Candlestick Patterns
- 4.1 1. Doji Candlestick Patterns
- 4.2 2.Hammer candlestick pattern
- 4.3 3. Shooting Star Candlestick Patterns
- 4.4 4. Bullish Engulfing Candlestick Patterns
- 4.5 5. Bearish Engulfing Candlestick Patterns
- 4.6 6. Morning Star Candlestick Patterns
- 4.7 7. Evening Star Candlestick Patterns
- 4.8 8. Three White Soldiers Candlestick Patterns
- 4.9 9. Three Black Crows Candlestick Patterns
- 4.10 10. Spinning Top Candlestick Patterns
- 4.11 11. Inverted Hammer Candlestick Patterns
- 4.12 12. Hanging Man Candlestick Patterns
- 4.13 13. Bullish Harami Candlestick Patterns
- 4.14 14. Bearish Harami Candlestick Patterns
- 4.15 15. Tweezer Tops Candlestick Patterns
- 4.16 16. Tweezer Bottoms Candlestick Patterns
- 4.17 17. Rising Three Methods Candlestick Patterns
- 4.18 18. Falling Three Methods Candlestick Patterns
- 4.19 19. Dark Cloud Cover Candlestick Patterns
- 4.20 20. Piercing Line Candlestick Patterns
- 4.21 21. Evening Doji Star Candlestick Patterns
- 4.22 22. Morning Doji Star Candlestick Patterns
- 4.23 23. Shaven Head Candlestick Patterns
- 4.24 24. Shaven Bottom Candlestick Patterns
- 4.25 25. Gap Up Candlestick Patterns
- 4.26 26. Gap Down Candlestick Patterns
- 4.27 27. Bullish Belt Hold Candlestick Patterns
- 4.28 28. Bearish Belt Hold Candlestick Patterns
- 4.29 29. High Wave Candlestick Patterns
- 4.30 30. Long-Legged Doji Candlestick Patterns
- 4.31 31. On Neck Line Candlestick Patterns
- 4.32 32. In Neck Line Candlestick Patterns
- 4.33 33. Thrusting Candlestick Patterns
- 4.34 34. Upside Tasuki Gap Candlestick Patterns
- 4.35 35. Downside Tasuki Gap Candlestick Patterns
- 4.36 36. Gravestone Doji Candlestick Patterns
- 4.37 37. Dragonfly Doji Candlestick Patterns
- 4.38 38. Rounding Bottom Candlestick Patterns
- 4.39 39. Rounding Top Candlestick Patterns
- 4.40 40. Bullish Triangle Candlestick Patterns
- 4.41 41. Bearish Triangle Candlestick Patterns
- 4.42 42. Cup and Handle Candlestick Patterns
- 4.43 Candlestick Pattern Analysis Techniques
- 4.44 Download 35 powerful candlestick patterns pdf
- 5 FAQ
- 5.1 What is the history and origin of candlestick charts?
- 5.2 Why are candlestick patterns essential for traders?
- 5.3 What are some common bullish candlestick patterns?
- 5.4 How can traders identify bearish reversal signals?
- 5.5 What are continuation candlestick patterns, and how can they be used?
- 5.6 Where can I find a comprehensive PDF guide covering all candlestick patterns?
- 5.7 How can traders combine candlestick patterns with other technical indicators?
- 5.8 What are some effective candlestick pattern-based trading strategies?
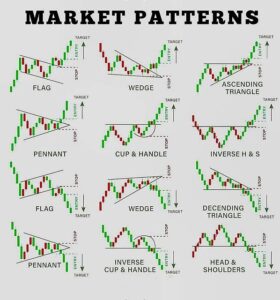
Bullish Candlestick Patterns
Candlestick patterns play a huge role in finance studies in the financial markets. These help detect potential bullish trends and signals for reversals. Knowing how to read them will guide the trader as to when these market sentiments can go good buying opportunities.
Bulls of Bullish Candlestick Patterns, hammer, inverted hammer, morning star, and engulfing patterns information should be needed. They help the trader in identifying both bullist reversal patterns and bullist continuation patterns. Such patterns give the trader good opportunities from which one can make better decisions.
| Bullish Candlestick Pattern | Description | Potential Implications |
|---|---|---|
| Hammer | Small body, long lower wick | Signals a potential bottom and possible reversal from a downtrend |
| Inverted Hammer | Small body, long upper wick | Indicates a potential bullish reversal at the end of a downtrend |
| Morning Star | Three-candlestick pattern: bearish, small-bodied, bullish | Suggests a potential shift in market sentiment from bearish to bullish |
| Engulfing Pattern | A large bullish candlestick “engulfs” the previous bearish candlestick | Signals a potential trend reversal from bearish to bullish |
Bearish Candlestick Patterns
Bearish Candlestick Patterns are key in technical analysis for traders. They show a possible drop or change in market direction. Knowing how to spot these patterns can greatly help traders in the fast-changing financial world.
Continuation Candlestick Patterns
In the world of candlestick chart analysis, Continuation Candlestick Patterns are key. They help identify the strength and direction of a market trend. These patterns show that the trend is likely to keep going, giving traders valuable insights.
Reversal Candlestick Patterns
Reversal Candlestick Patterns are key to spotting market direction changes. They show when a trend might switch, helping traders adjust their plans. Let’s look at the main bullish and bearish patterns every trader should know.
| Candlestick Pattern | Reversal Signal | Interpretation |
|---|---|---|
| Hammer | Bullish | Indicates a potential bottom and a possible reversal to the upside. |
| Inverted Hammer | Bullish | Suggests a potential bottom and a possible reversal to the upside. |
| Shooting Star | Bearish | Signals a potential top and a possible reversal to the downside. |
| Hanging Man | Bearish | Indicates a potential top and a possible reversal to the downside. |
All Candlestick Patterns Pdf Free Download
| No. | Pattern | Type | Description |
|---|---|---|---|
| 1 | Hammer | Bullish | Small body, long lower shadow, no upper shadow. Seen after a decline; it is considered a reversal sign. |
| 2 | Inverted Hammer | Bullish | Small body, long upper shadow, no lower shadow. A potential bullish reversal signal if the trend was down. |
| 3 | Bullish Engulfing | Bullish | A little red candle is eaten by a larger green candle that consumes the first, signifying a change. |
| 4 | Piercing Line | Bullish | Then a green candle opened lower but closes more than halfway into the body of the previous red candle. |
| 5 | Morning Star | Bullish | A three-candle pattern showing a bullish trend change from the downtrend. |
| 6 | Three White Soldiers | Bullish | Three consecutive long green candles with very small shadows continue the rising momentums. |
| 7 | Rising Three Methods | Bullish | This was followed by a series of small bearish candles and another strong green candle, continuing the uptrend. |
| 8 | Dragonfly Doji | Bullish | Doji with no upper shadow but very long lower shadow. The pattern meant a reversal after a downtrend. |
| 9 | Tweezer Bottoms | Bullish | Two candles with approximately equal lows after a fall, which reflects the turn. |
| 10 | Bullish Harami | Bullish | There is a small green candle inside the body of the previous red candle, showing weakness in downtrend strength. |
| 11 | Three Inside Up | Bullish | It was a bullish harami followed by a confirmation green candle, one that closes higher than the previous one. |
| 12 | Kicker Pattern | Bullish | In reversal pattern: There is a bullish candle which the gap has already occurred in the opposite direction, then a bearish candle. |
| 13 | Doji Star | Bullish | A doji appearing after a very long bearish candle suggests indecision or even possible reversal of an already well-established downtrend. |
| 14 | Homing Pigeon | Bullish | It is a small bearish candle in a larger bearish candle, indicating potential reversal. |
| 15 | Stick Sandwich | Bullish | A pattern exhibiting two bearish candles flanking a bullish candle, reversal. |
| 16 | Falling Wedge | Bullish | A succession of failing candles with every high and low being lower, which may suggest a reversal to the upside. |
| 17 | Bullish Belt Hold | Bullish | Long bullish candle with no lower shadows, opens on the low and travels north. |
| 18 | Shooting Star | Bearish | Small body, but the long upper shadow comes after an uptrend-reversing seems possible. |
| 19 | Hanging Man | Bearish | This is a hammer but a hammer following an uptrend-a very typical upside-down reversal candle pattern. |
| 20 | Bearish Engulfing | Bearish | A small green candle is then replaced by a bigger one red, which envelops the former entirely. It reverses meaning. |
| 21 | Dark Cloud Cover | Bearish | A green candle followed by a red candle. This red candle will open higher than the last high of the green candle but close lower than the midpoint of the green candle. |
| 22 | Evening Star | Bearish | Intricately featured in three candles, this pattern signals a bearish reversal following an uptrend. |
| 23 | Three Black Crows | Bearish | Three consecutive long red candles with small shadows mean downtrend force is very strong. |
| 24 | Falling Three Methods | Bearish | A long red candle and then small bullish candles, followed by another very strong red candle, which indicates the continuation of the downtrend. |
| 25 | Gravestone Doji | Bearish | A long upper shadow doji without the lower shadow can be interpreted as a possible reversal of the original uptrend. |
| 26 | Tweezer Tops | Bearish | Two candles with similar highs after an uptrend indicate a possible reversal. |
| 27 | Bearish Harami | Bearish | A small red candle inside the body of the prior green candle is indicative that the uptrend has weakened. |
| 28 | Three Inside Down | Bearish | It is followed by confirmation – a red candle that closes below the previous candle. |
| 29 | Bearish Kicker | Bearish | A reversal pattern where a strong bearish candle appears after a gap in the opposite direction of a bullish candle. |
| 30 | Doji Star | Bearish | After an uptrend established, after a long bullish candle, it’s a doji, so this represents indecision or even possible reversal. |
| 31 | Abandoned Baby | Bearish | This three-candle pattern emits a good reversal signal following an uptrend. Gap up followed by a doji then a gap down. |
| 32 | Shooting Star | Bearish | A long upper shadow and small body is left behind after an uptrend, indicating a reversal. |
| 33 | Bearish Belt Hold | Bearish | This is a long bearish candle with no upper shadow, open higher, and then went down. |
| 34 | Bearish Tri-Star | Bearish | A three-doji pattern rising at the top of an uptrend signals a reversal. |
| 35 | Hanging Man | Bearish | The bearish candle has a long lower shadow and is set up after an uptrend signifying probable reversal. |
35 Powerful Candlestick Patterns
1. Doji Candlestick Patterns
Description: If the opening and closing prices are so close to each other that the body is very small, then it is a doji. Each side can have abundant long wicks.
Doji Meaning: Indicates that the market is confused. It happens at most times after having had a strong trend, as by this stage, the buyers and sellers are in a balance mode. The trader waits for confirmation in the following candles about the direction.
2.Hammer candlestick pattern
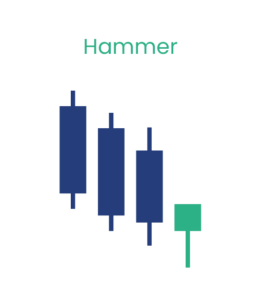
Description: Hammer has a body relatively small at top and wick at the lower side long but appears after a downtrend.
Meaning: Here, the sellers pushed the price downwards, but buyers had to react to push the price back. It is a bullish reversal signal if confirmed by subsequent bullish candle.
3. Shooting Star Candlestick Patterns
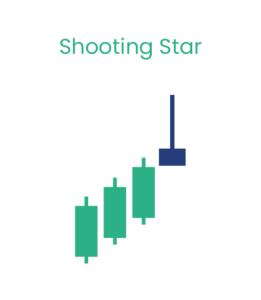
Description: Its body is relatively small having an upper wick very long; it generates after an up trend.
Significance : This pattern reveals that the buyers tried to drive prices higher but were stopped from doing so by selling pressures. This pattern may suggest a bearish reversal.
4. Bullish Engulfing Candlestick Patterns

Description: It is a Bullish Engulfing pattern with the appearance of a small bearish candle followed by a bigger bullish candle that engulfs the former totally.
This means a market with strong buying pressure and has potentially reversing from bearish into a bullish trend.
5. Bearish Engulfing Candlestick Patterns

Description: This is looking like a small bullish candle followed by a long bearish candle that engulfs the former.
Maverick Recommendation: Because this did send the momentum back in favor of the bears, it was a bearish reversal signal.
6. Morning Star Candlestick Patterns
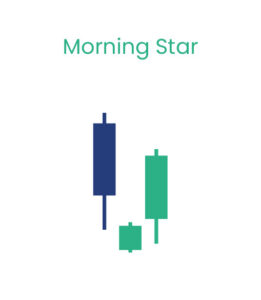
Description: Morning Star is the three candles which are bearish candle small-bodied candle and bullish candle.
Significance: This is a bearish-bullish pattern since the body remains small in size, justifying indecision followed by some strong bullish movement.
7. Evening Star Candlestick Patterns

Description: Evening Star is just an opposite pattern of Morning Star, namely an bearish candle with a small body and a bullish one.
This is a sign of reversing the trend from up to down, where buying pressure alleviated.
8. Three White Soldiers Candlestick Patterns

Description: It is characterized by three consecutive bullish rising candles that each close higher than the previous one.
Significance: It shows highly positive sentiment and confidence of buyers, so the trend is going to continue up.
9. Three Black Crows Candlestick Patterns
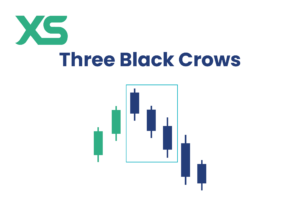
Description: Three Black Crows is three back-to-back bearish candles with every one of them bearing a lower closing than the preceding one.
Significance: Selling pressure has been sharp so that the downtrend might continue.
10. Spinning Top Candlestick Patterns
Description: Inverted Hammer is a small lower body with a long upper wick and is generally appearing at the end of a downtrend.
Significance: It is a situation in which the buyers were not able to push the prices up. Confirmation with the next candle is a bullish reversal.
11. Inverted Hammer Candlestick Patterns

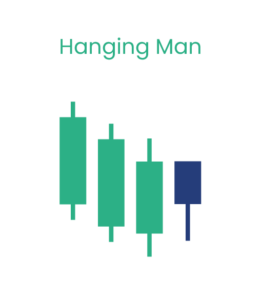
Description: Hanging Man is a sort of inverted hammer that appears on the last-end of an uptrend, showing a long lower wick and a small body on top.
Meaning: This means that the sellers are gaining strength and could eventually form a bearish reversal.
12. Hanging Man Candlestick Patterns
Description: A Bullish Harami is a candle pattern consisting of a longer bearish candle and inside the body of which, a smaller bullish candle fits.
Significance: This pattern is somewhat similar to some forms of bull reversals because the sellers lose their momentum.
13. Bullish Harami Candlestick Patterns

Description :The bearish harami is a candlestick formation where there is a large bullish candle with a small bearish candle inside the bigger one.
It is also a bearish reversal sign, which means buyers’ control is fading.
14. Bearish Harami Candlestick Patterns

15. Tweezer Tops Candlestick Patterns
Description: Tweezer Tops are two candles with the same highs preceded by a bearish candle.
Relevance: This is a bearish reversal pattern that indicates the inability of buyers to push the prices up.
16. Tweezer Bottoms Candlestick Patterns
Description: Tweezer Bottoms The chart has two candles with the same lows and a bullish candle.
Implication: It is probably a bullish reversal. Here, selling pressure is slowly fading off.
17. Rising Three Methods Candlestick Patterns
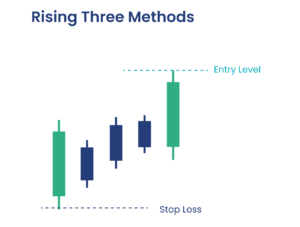
Description: It is a pattern in which a bullish candlestick is followed by three tiny bearish candles, and then another bullish candle.
It means that the uptrend will continue, and that is, the buyers are in control.
18. Falling Three Methods Candlestick Patterns
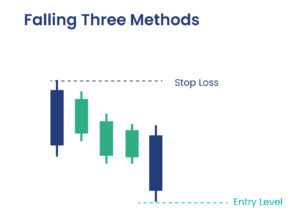
Description: Falling Three Methods It describes a short bearish candle followed by three very small bullish candles again followed by one very small bearish candle.
The significance: it is still a continuation of the downtrend; sellers are still in control.
19. Dark Cloud Cover Candlestick Patterns

Description: In the pattern, there is a bull candle and then a bearish candle with opening above the high of the first and closing below the midpoint.
Significance: It could be a bearish reversal sign or the buyers are losing grip.
20. Piercing Line Candlestick Patterns
Description: Piercing Line : A bearish candle that follows a bullish one; opens below the low of the first one and closes above its midpoint.
This is a bullish reversal signal that manifests strength in buying.
21. Evening Doji Star Candlestick Patterns
Description: In this pattern, there is a bullish candle, followed by the doji, and then a bearish candle.
Meaning: The Morning Doji Star tells that it is a bearish reversal, as the doji confirms indecision before the downward move.
22. Morning Doji Star Candlestick Patterns
Description: The Morning Doji Star pattern is a bearish candle, followed by a doji, and then a bullish candle.
Meaning: It tells that this is a bullish reversal, as the doji shows indecision followed by a strong upward move.
23. Shaven Head Candlestick Patterns
Description: A Shaven Head candle will have no upper shadow. This means a tremendous buying pressure.
Importance: This pattern informs you that buyers are the in control; it often leads to a continuation of a trend.
24. Shaven Bottom Candlestick Patterns
Description: A Shaven Head candle will have no upper shadow. This means a tremendous buying pressure.
Importance: This pattern informs you that buyers are the in control; it often leads to a continuation of a trend.
25. Gap Up Candlestick Patterns
Description: A gap up is defined by a candle whose opening price is higher than the closing price of the previous candle.
Importance: This marks heavy buying pressure. It is marked as starting an uptrend.
26. Gap Down Candlestick Patterns
Description: A Gap Down occurs when the opening price of a candle is lower than the previous candle’s closing price.
Significance: It indicates strong selling pressure, often signaling the start of a downward trend.
27. Bullish Belt Hold Candlestick Patterns
Description: This pattern consists of a single bullish candle that opens at the low of the day.
Significance: It indicates strong bullish sentiment and often precedes an upward price movement.
28. Bearish Belt Hold Candlestick Patterns
Description: The Bearish Belt Hold consists of a single bearish candle that opens at the high of the day.
Significance: It indicates strong bearish sentiment and often precedes a downward price movement.
29. High Wave Candlestick Patterns
Description: A High Wave candle features long wicks and a small body, indicating high volatility.
Significance: This pattern reflects uncertainty in the market, often signaling indecision about the future direction.
30. Long-Legged Doji Candlestick Patterns
Description: A Long-Legged Doji has long upper and lower wicks, indicating significant volatility with a small body.
Significance: It signifies extreme indecision, often leading to potential reversals depending on the following candles.
31. On Neck Line Candlestick Patterns
Description: The On Neck Line pattern consists of a bullish candle followed by a small bearish candle that closes near the bottom of the first.
Significance: It signals a potential bearish reversal, suggesting that sellers may be gaining strength.
32. In Neck Line Candlestick Patterns
Description: The In Neck Line consists of a bullish candle followed by a small bearish candle that closes below the first candle.
Significance: It indicates a bearish reversal, suggesting that selling pressure is increasing.
33. Thrusting Candlestick Patterns
Description: The Thrusting pattern consists of a bullish candle followed by a bearish candle that closes within the body of the first.
Significance: It indicates continuation of the trend, suggesting that the bullish momentum may still be in play.
34. Upside Tasuki Gap Candlestick Patterns
Description: This pattern consists of a bullish candle followed by a gap and a small bearish candle.
Significance: It indicates bullish continuation, suggesting that buyers are still in control.
35. Downside Tasuki Gap Candlestick Patterns
Description: The Downside Tasuki Gap consists of a bearish candle followed by a gap and a small bullish candle.
Significance: It indicates bearish continuation, suggesting that sellers remain dominant.
36. Gravestone Doji Candlestick Patterns
Description: A Gravestone Doji has a long upper shadow with no lower shadow, appearing at market peaks.
Significance: It signals a potential bearish reversal, indicating that buyers have lost control.
37. Dragonfly Doji Candlestick Patterns
Description: The Dragonfly Doji features a long lower shadow and no upper shadow, appearing at market bottoms.
Significance: It indicates a potential bullish reversal, suggesting that buyers may be stepping in.
38. Rounding Bottom Candlestick Patterns
Description: The Rounding Bottom pattern resembles a bowl and indicates a gradual transition from a downtrend to an uptrend.
Significance: It suggests a bullish reversal, often seen as a long-term signal.
39. Rounding Top Candlestick Patterns
Description: The Rounding Top is the opposite of the Rounding Bottom, resembling an inverted bowl.
Significance: It indicates a potential bearish reversal, often seen as a long-term signal.
40. Bullish Triangle Candlestick Patterns
Description: A Bullish Triangle forms when there are higher lows and a flat top, indicating a consolidation phase.
Significance: It suggests a potential bullish breakout as buyers gain momentum.
41. Bearish Triangle Candlestick Patterns
Description: A Bearish Triangle forms when there are lower highs and a flat bottom, indicating a consolidation phase.
Significance: It suggests a potential bearish breakout as sellers gain control.
42. Cup and Handle Candlestick Patterns
Description: The Cup and Handle pattern consists of a rounded bottom (cup) followed by a consolidation phase (handle).
Significance: It indicates a bullish continuation, suggesting that the price may break out to the upside.
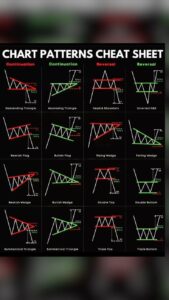
Candlestick Pattern Analysis Techniques
important key factor for a trader is to learn and analyzing the candlestick patterns. with this candlestick patterns trader get some technical hint with this help of your analysis gets stronger.
Download 35 powerful candlestick patterns pdf
FAQ
What is the history and origin of candlestick charts?
Candlestick charts started in 18th-century Japan. Rice traders created them to understand market trends.
Why are candlestick patterns essential for traders?
These patterns reveal market psychology. They help predict price movements. This makes them key for traders to improve their strategies.
What are some common bullish candlestick patterns?
Patterns like the hammer and morning star show a possible upturn. Engulfing patterns also signal a potential rise.
How can traders identify bearish reversal signals?
Signals like the shooting star and dark cloud cover warn of a possible downturn. They help traders prepare for a market drop.
What are continuation candlestick patterns, and how can they be used?
Patterns like the three white soldiers show the trend’s strength. They help traders understand the market’s direction.
Where can I find a comprehensive PDF guide covering all candlestick patterns?
This section offers a downloadable PDF. It covers all key candlestick patterns. It includes their meanings and how to use them, making it a great resource for traders.
How can traders combine candlestick patterns with other technical indicators?
Using tools like moving averages and trend lines with candlestick patterns can improve analysis. It leads to better trading decisions.
What are some effective candlestick pattern-based trading strategies?
Traders can create systems based on recognizing patterns. This includes setting entry and exit points and managing risks. It helps improve trading results.